
Bitcoin enters mid-July 2026 near $63,400 — down roughly half from the $126,200 all-time high printed the week of 6 October 2025, and −46% year-over-year. The weekly chart shows an unbroken staircase of lower highs from the top, a genuine capitulation event in early June, an undercut of the February low that failed to follow through — and price now resting almost exactly on the 200-week simple moving average (~$62,900), the line that has historically marked terminal bear-market floors for BTC.
That confluence — washed-out momentum, a possible failed breakdown, and the single most-watched long-cycle average underfoot — makes this the defining test of the entire decline.
Signal over noise: a 2× volume capitulation, an undercut low that reclaims within a week, and oscillators pinned at oversold extremes is how bear markets end — but every one of those signals is still unconfirmed. The chart has earned a bounce; it has not yet earned a bottom.
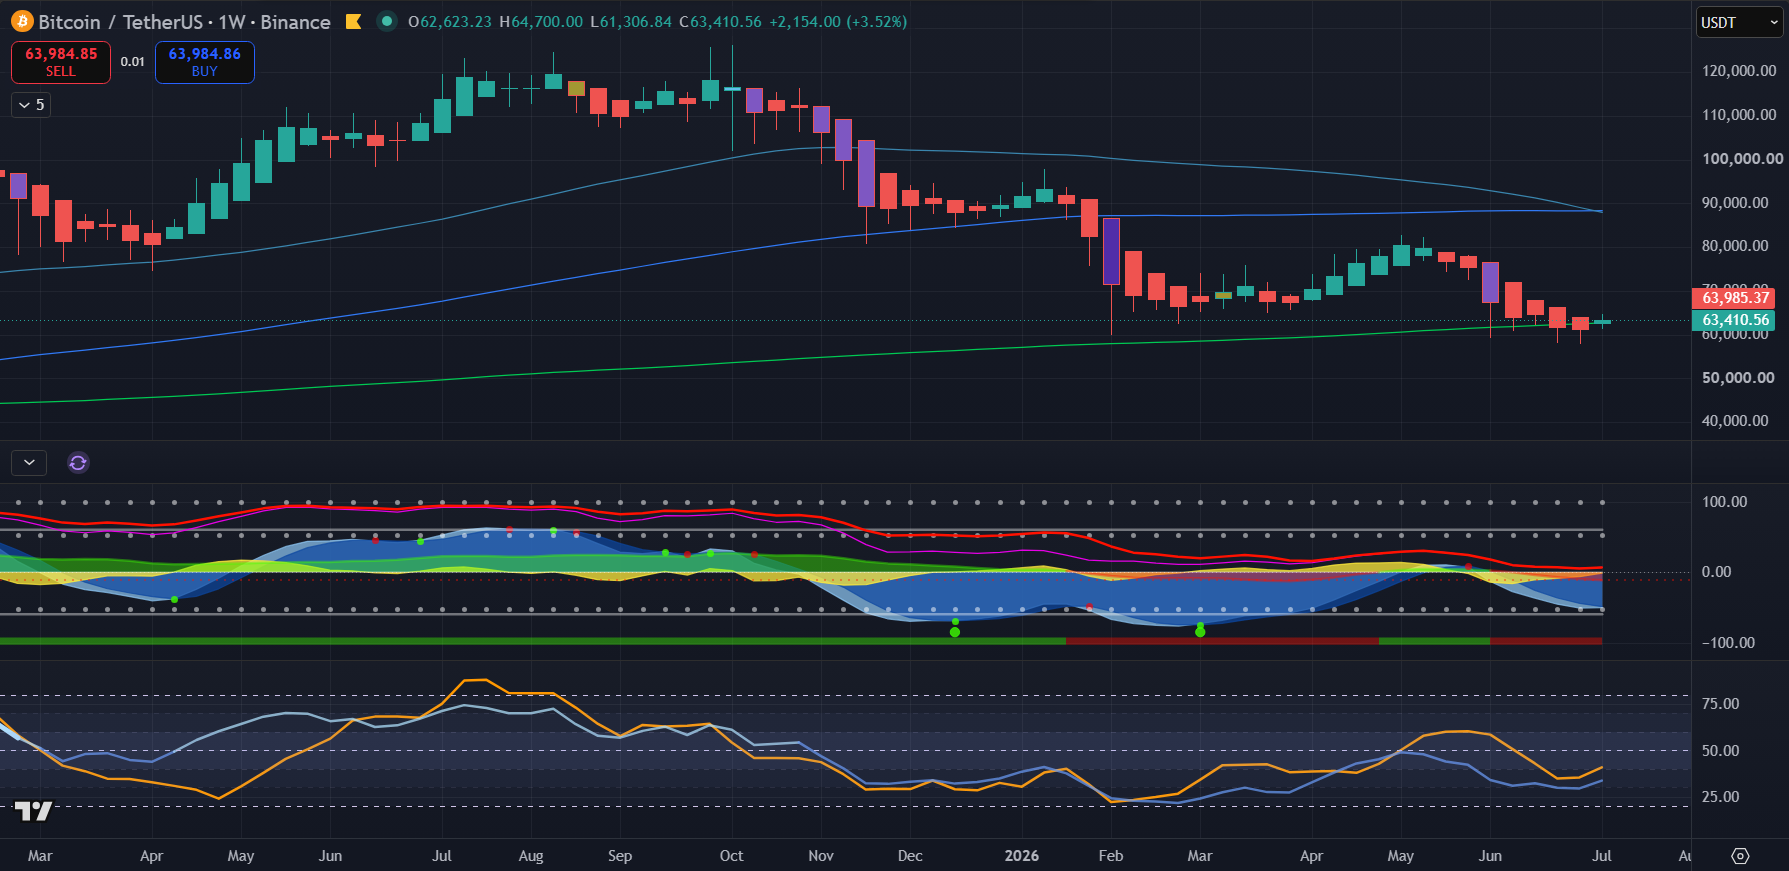
The decline: a staircase with no missing steps
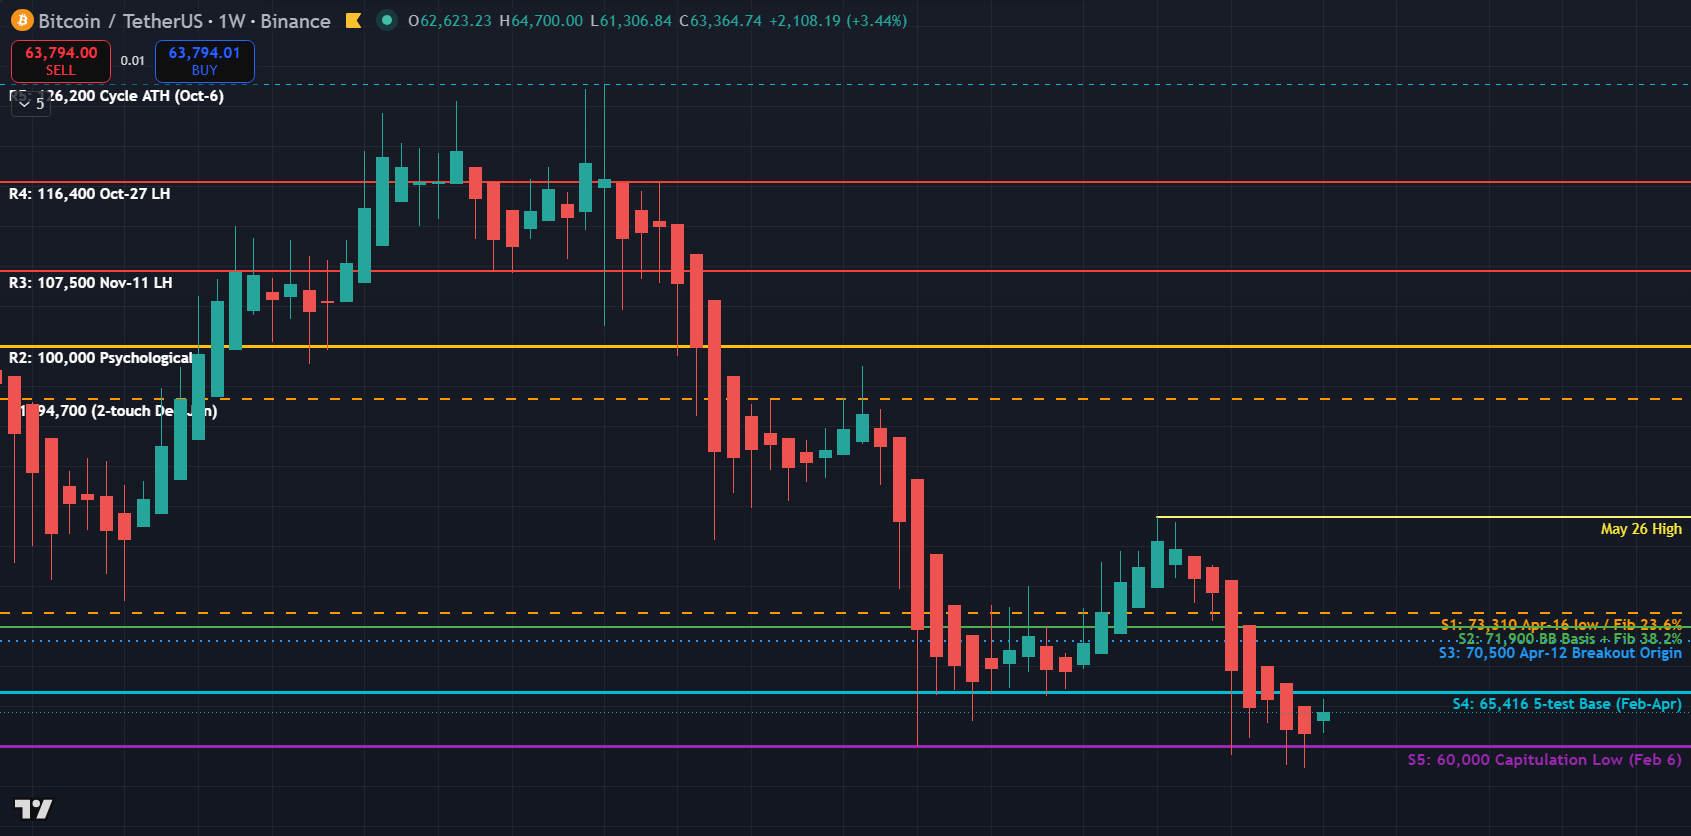
From the October top, every rally has failed at a lower level: $126,200 → ~$116,400 (late Oct) → ~$107,500 (Nov) → ~$97,900 (Jan) → $82,850 (May). That last lower high — the "May 26 High" — is the level that currently defines the downtrend: until a weekly close reclaims $82,850, the sequence is intact and every bounce is guilty until proven innocent.
The lows tell a more interesting story. February's capitulation bottomed at $60,000; June undercut it to $57,800 — and that undercut is where the bear case first stumbled.
June: capitulation, undercut, reclaim
The week of 1 June was the liquidation event of this decline: −14% close-to-close, a low of $59,131, on 231,930 volume — roughly twice the 12-week average. Three weeks later price undercut to $57,800 on less volume, held for five sessions, and reclaimed the $60,000 shelf the following week with a +6.8% green candle.
An undercut of a prior capitulation low that fails to attract new selling and reclaims within days is the classic spring / failed-breakdown setup. The catch: the two-week bounce since has come on declining volume (118,679 → ~88,000, well below the 52-week average of 132,521). Seller exhaustion, or buyer absence — the tape hasn't said which yet. The disambiguating level is $65,416, a shelf price tested five times between February and April: a weekly close above it on above-average volume converts the June undercut into a confirmed spring.
The 200-week line
Price sits +0.9% above the 200-week SMA at ~$62,900. In 2015, December 2018, March 2020, and November 2022, this average marked the terminal zone of every Bitcoin bear market — touched, briefly pierced, never sustainably lost outside those capitulation windows. Meanwhile every other major average is falling overhead: the 50-week (~$87,500) has crossed below the 100-week (~$88,500) in a long-cycle death cross, and the 30-week Weinstein stage line is declining at ~$74,000 — an unambiguous Stage-4 structure above a historically terminal floor below.
Two consecutive weekly closes under ~$62,900 would be historically anomalous outside a final capitulation — and would argue this decline has another leg.
Momentum: washed out, not yet turned
| Indicator (weekly) | Reading | Interpretation |
|---|---|---|
| RSI(14) | 38.6 | Bearish regime, curling up from the June trough |
| MACD histogram | −216, from −339 | Still negative, momentum of the decline decelerating |
| MarketCipher-B blue wave | −47.5 | Deep oversold; buy-dots printed at the Feb and Jun lows |
| MarketCipher-B money flow | −9.6 | Buyers have not taken control |
| Stochastic RSI | 8.7 | Pinned at the floor |
| Prophesier MFI oscillator | 53.5 | Back above the 50 midline — first constructive read |
This is the classic late-decline profile: extremes on the levels, improvement in the first derivatives, no confirmation in the flows. Momentum supports a bounce; it does not yet support a reversal.
The map: structure and Fibonacci agree
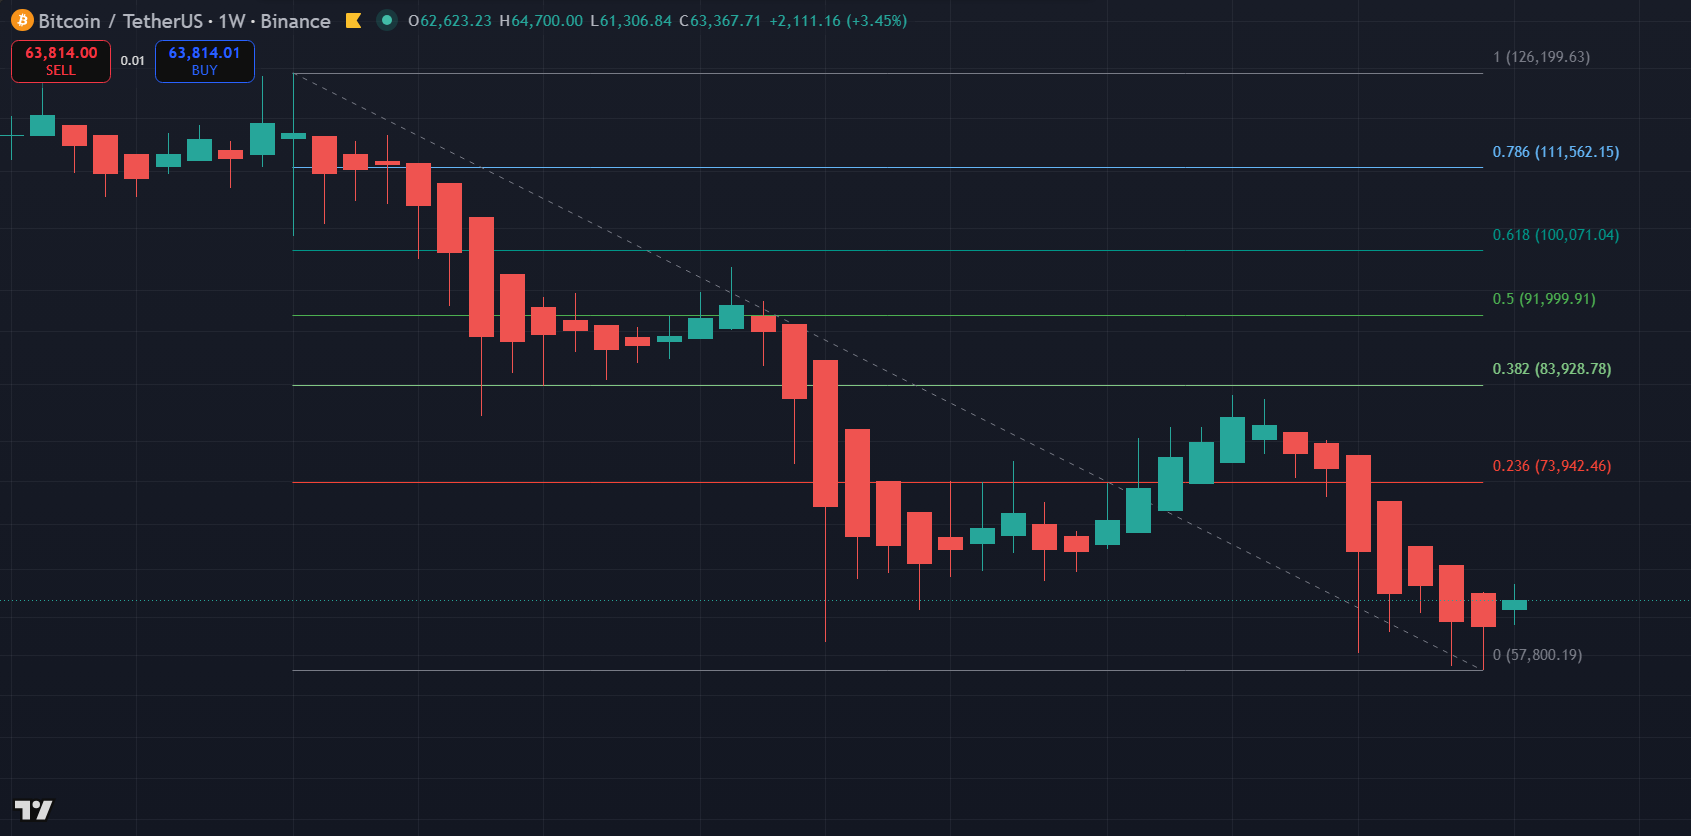
Retrace the entire decline ($126,200 → $57,800) and the Fibonacci levels land, with unusual precision, on the chart's own structure:
| Level | Price | Confluence |
|---|---|---|
| Fib 0.236 | ~$73,900 | The $70,500–$73,300 supply shelf (April breakout origin + April low) |
| Fib 0.382 | ~$83,900 | Just above the $82,850 downtrend-defining lower high |
| Fib 0.5 | ~$92,000 | Below the $94,700 two-touch resistance; 50W/100W SMAs between |
| Fib 0.618 | ~$100,100 | The $100,000 psychological level, almost exactly |
| Fib 0.786 | ~$111,600 | Between the November and October lower highs |
Levels that matter
| Level | Price | Role |
|---|---|---|
| Cycle ATH | $126,200 | Resistance · Oct-2025 ceiling |
| Downtrend line-in-sand | $82,850 | Resistance · reclaim breaks the lower-high sequence |
| Supply shelf | $70,500–$73,310 | Resistance · April breakout origin + fib 0.236 |
| First confirmation | $65,416 | Resistance · 5-test base; close above on volume = confirmed spring |
| 200-week SMA | ~$62,900 | The battleground · historical bear-market floor |
| Capitulation shelf | $60,000 | Support · bounce invalidated below |
| Cycle low | $57,800 | Support · the June undercut |
| Air pocket | $52,550–$53,500 | Support · 2024 consolidation shelf if $57.8k breaks |
| Deep support | $49,000 | Support · August-2024 low |
Scenarios
- Bull case — spring confirmation. A weekly close above $65,416 on above-average volume (≥ ~115k) confirms the failed breakdown. Targets step through the $70,500–$73,310 shelf toward the $82,850 decision level; above that, the lower-high sequence is broken and a Stage-1 base is in play. Supporting evidence already on the chart: buy-dots at both lows, Sto-RSI at 8.7, contracting MACD histogram, MFI back above 50.
- Base case — range repair. The $57,800–$60,000 floor holds; rallies stall into the falling short-term averages and the $70,500–$73,310 supply. Weeks of sideways while the 10/20-week SMAs compress onto price. Neutral until either boundary breaks on volume.
- Bear case — the floor fails. A weekly close below ~$62,900 that isn't reclaimed within a week or two, then loss of $57,800, opens a thin air pocket to $52,550–$53,500 and then $49,000. A sustained 200-week breakdown would be historically anomalous — which is precisely why it would be so significant.
Bottom line
Everything bearish about this chart is already obvious: a 50% drawdown, a perfect staircase of lower highs, every meaningful average falling overhead. What is not yet obvious is how it resolves from here — and that is what the 200-week line will decide. The undercut-and-reclaim at $57,800, the oversold extremes, and the improving momentum derivatives are how major lows start; the anemic bounce volume is how bear-market rallies start. The tape's tell is narrow and specific: $65,416 on volume upgrades the bounce to a bottom; two weekly closes under $62,900 downgrades it to a pause before lower. Until one of those prints, this is a bounce inside a bear trend — trade it as such.
Method & sources: Derived from the live BINANCE:BTCUSDT weekly chart (Heikin Ashi display; all figures computed on true OHLC candles). Moving-average lengths verified by matching plotted values against the bar series; weekly RSI cross-validated against the on-chart Prophesier v6.10 read (38.6 vs 38.54). Momentum readings from MarketCipher_B and Prophesier v6.10; levels read from hand-annotated structure and 300 weekly bars of pivot analysis. Companion read: Bitcoin tests the $60k floor from 28 June, written the week the undercut reclaimed.
Not financial advice. Automated technical analysis of public price data as of 10 July 2026. Weekly ATR is ~11% of price — expect violent moves in both directions around these levels; verify on your own chart before acting.