
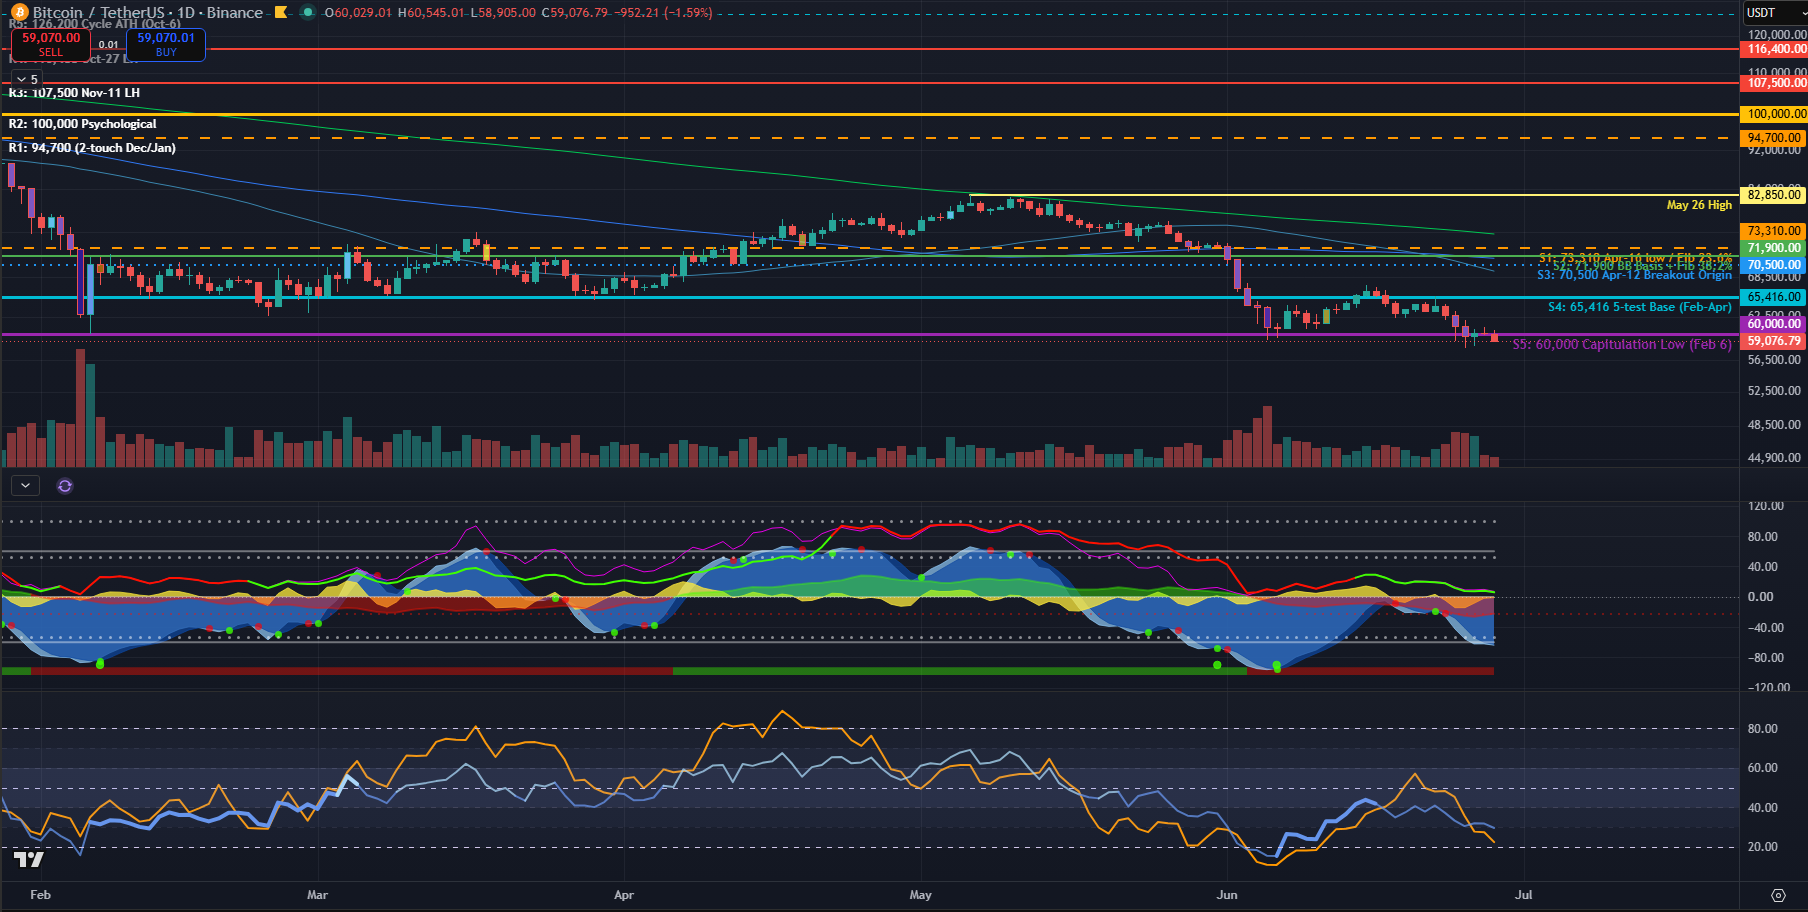
Bitcoin closes the session at $59,037, down 1.65% on the day and pressing into the $60,000 floor that marked February's capitulation low. This is the weakest the asset has traded since 2024. The trend is bearish on every horizon — but the manner of the decline matters as much as the direction, and right now the tape is sending two opposing signals at once.
Signal over noise: price is breaking down, but volume is drying up and momentum is wrung out. That is the footprint of seller exhaustion, not fresh distribution.
Overall trend — bearish, and structurally so
Price sits below all three major moving averages, and the averages are stacked in bearish order (shorter beneath longer) — a textbook downtrend alignment:
- 50-SMA ≈ $69,458
- 100-SMA ≈ $71,557
- 200-SMA ≈ $75,716
The descent from the $126,200 cycle ATH (Oct-6) has printed clean lower highs at $116.4K (Oct-27) and $107.5K (Nov-11) — distribution, not accumulation. Off-chart, BTC also trades well under its ~$80K 20-month EMA. A roughly 53% drawdown from the peak places it firmly in deep-correction territory, consistent with the −16.3% slide over the trailing 100 sessions.
Short-term price action — a quiet grind, not a flush
The near-term character is the interesting part:
- Testing the $60K capitulation floor. The Feb-6 low at $60,000 is the line in the sand; intraday prints have already dipped beneath it (day low $58,905; 100-day low $58,115).
- Volume is fading, not spiking. The last two daily bars traded just 9.6K and 8.4K versus the 27–30K seen on the bars into this zone. A market accelerating to the downside expands volume; this one is contracting it — the hallmark of sellers running thin.
- Momentum is exhausted. MarketCipher_B's Blue Wave sits at −62.8 (below the −60 oversold band) with Money Flow negative at −22.6, while its internal RSI/StochRSI read 7.0 / 5.7 — about as stretched as these get.
- Balanced on the baseline. The Prophet v3.022 plot rests at $59,018, right at spot. A daily close back above it would be the first micro-sign of stabilization.
What the indicators say
| Indicator | Reading | Signal |
|---|---|---|
| SMA 50 / 100 / 200 | 69,458 / 71,557 / 75,716 | Bearish stack — all overhead |
| Prophet v3.022 (baseline) | 59,018 | At price — pivot |
| MarketCipher_B — Blue Wave | −62.8 | Oversold (< −60) |
| MarketCipher_B — Money Flow | −22.6 | Negative / distribution |
| MarketCipher_B — RSI / StochRSI | 7.0 / 5.7 | Extreme oversold |
| Prophesier v6.10 — RSI | 29.5 | Oversold (< 30) |
| Prophesier v6.10 — MFI | 22.5 | Oversold |
| Volume vs Volume MA | 8.4K / 16.9K | Below average — low conviction |
Support & resistance map
With price at $59K, the levels the chart originally drew as support (S1–S4, the $65K–$73K band) now sit overhead as resistance. Genuine support below is thin — the swing low and round numbers.
| Level | Price | Role now | Note |
|---|---|---|---|
| Cycle ATH | 126,200 | Resistance | Oct-6 peak |
| Lower high | 116,400 | Resistance | Oct-27 |
| Lower high | 107,500 | Resistance | Nov-11 |
| Psychological | 100,000 | Resistance | Round number |
| 2-touch | 94,700 | Resistance | Dec/Jan |
| Swing high | 82,850 | Resistance | May-26 |
| Supply shelf | 70,500 – 73,310 | Resistance | Old "support" band, now overhead |
| 5-test base | 65,416 | Resistance | Feb–Apr |
| Capitulation low | 60,000 | Pivot / being tested | Feb-6 |
| Swing low | 58,115 | Support | 100-day low |
| Psychological | 55,000 | Support | Next demand |
| Macro level | 50,000 | Support | Last-ditch |
Market sentiment & flows
Sentiment is washed out. The Crypto Fear & Greed Index sits in Extreme Fear (12–17), collapsed from the "greed" zone (~57) earlier this year. The drivers are macro and flow-based, not chart-based:
- Lowest since 2024. BTC slid below $60K amid a broad crypto sell-off.
- Record ETF outflows. Spot Bitcoin ETFs are on their longest daily-redemption streak on record — cumulative outflows of roughly $5.75B since mid-May — removing a key marginal bid.
- Rotation into AI equities. Capital is leaving crypto for AI-themed stocks.
- Regulatory overhang. A potential delay to the CLARITY Act adds policy uncertainty.
The contrarian footnote: capitulatory fear at these readings has historically preceded local bottoms. It confirms how damaged the tape is — and flags that the down-trade is crowded.
Scenarios
- Relief bounce (counter-trend). Extreme-oversold oscillators plus drying volume at $60K spark mean reversion. A daily close back above Prophet ($59K) then $60K opens a path toward the $65.4K base and the $70–73K supply shelf.
- Range / chop (base case). Price stabilizes between $58K and $65K as sellers exhaust but no catalyst appears. Flows dictate direction.
- Breakdown (bear case). A decisive close below the $58.1K swing low — on volume re-expansion — flushes toward $55K and potentially the $50K macro level. Accelerating ETF outflows would be the trigger.
Bottom line
The macro trend, sentiment, and flows all point the same direction: down. But the short-term tape is stretched — low volume into a major floor with momentum at the basement is a relief-bounce setup, not a fresh-breakdown one. The structure stays bearish until price reclaims the $65K–$73K supply shelf. Until then, treat bounces as counter-trend and the $58.1K swing low as the level that decides the next leg.
Sources: Yahoo Finance — BTC tumbles below $60K · Cryptonomist — key levels & sentiment · CoinDesk — sentiment · BanklessTimes — Fear & Greed · Alternative.me
Not financial advice. This is an automated technical read of live chart state plus public sentiment at the time of writing. Indicator values reflect the proprietary studies on the source chart and may differ from platform defaults. Verify levels before acting.