
Solana closes June 2026 near $73 — roughly 75% below the $295.83 all-time high it printed in January 2025, and about 23% under a 30-week moving average that is sloping down. On the weekly timeframe there is no ambiguity about the primary trend: lower highs, lower lows, a decisive break out of a two-year range, and price pinned in the lowest quartile of that range. This is a Stage-4 downtrend, plainly.
And yet, at the June low, something on the chart declined to cooperate. Price cut to a fresh cycle low of $60.13 — but the RSI, for the first time in this decline, made a higher low. That single refusal is the only constructive thing on an otherwise bearish weekly chart, and it is worth understanding precisely.
Signal over noise: a downtrend that keeps making lower price lows while momentum makes higher lows is not yet a reversal — it is a downtrend running out of sellers. Note it, size it, but do not confuse a crack of light for the dawn.
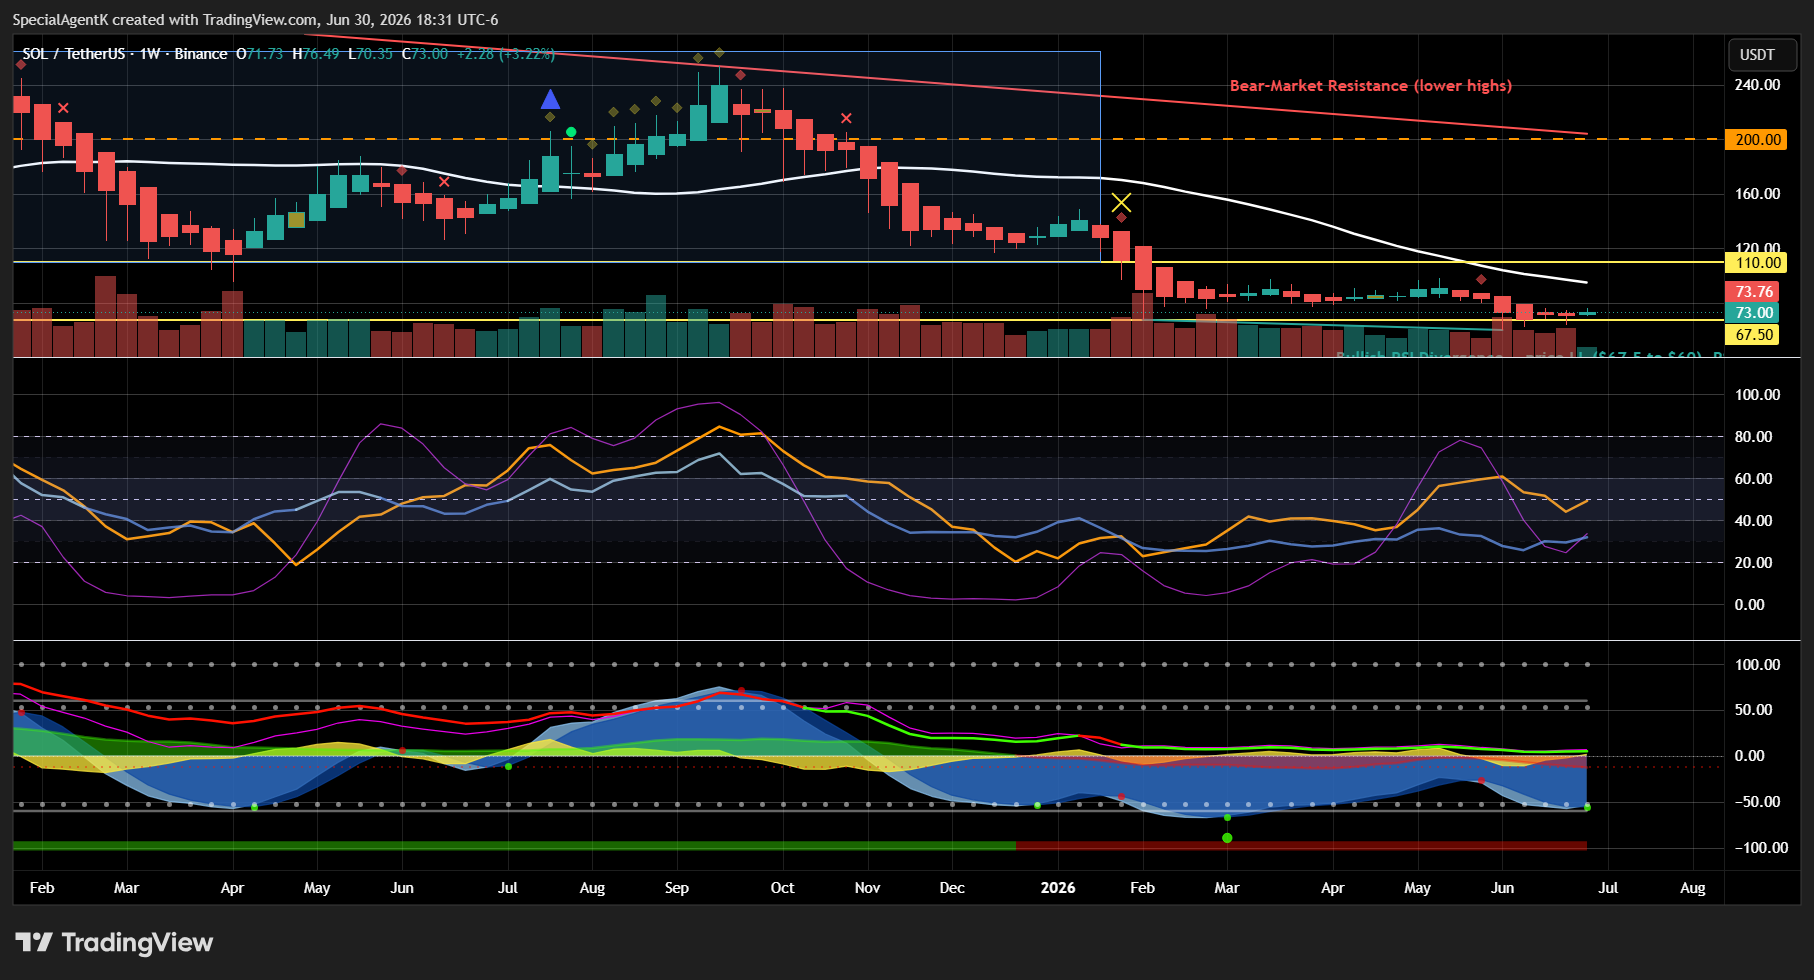
The setup: a two-year top that broke
From early 2024 through the start of 2026, SOL traded inside a broad range — roughly $110 support to $265 resistance — with the $295.83 all-time high standing out as a spike through the ceiling rather than a sustained breakout. That range was distribution: two years of supply being handed to buyers who are now underwater.
The range resolved downward, hard. In early February 2026 a single weekly candle ran from ~$121 to $67.50 — a ~25% range that sliced clean through the $110 floor. Old support became resistance; the market consolidated in the low-$80s to mid-$90s for a few months, failed to reclaim the range, and then flushed a second time in June to the $60.13 cycle low. Price now sits at ~$73, bouncing off that floor but below every major moving average and structural level.
The bear trendline — and the divergence that called the top
Anchor a line to the two dominant swing highs — the $295.83 ATH and the ~$253 September-2025 lower high — and you get the descending resistance that has capped every rally. It currently sits near $200, far overhead. Price trading this far beneath the bear line is the signature of a capitulated market, not a healthy pullback.
The RSI told this story before price did. Across the 2024–25 top, SOL made higher price highs while momentum made progressively lower ones:
| Date | Price high | Weekly RSI |
|---|---|---|
| Mar 2024 | ~$192 | 90 |
| Nov 2024 | ~$246 | 77 |
| Jan 2025 (peak) | ~$249 | 67 |
| Sep 2025 | ~$240 | 72 |
At the actual price peak, RSI was only 67 — not even overbought. That is textbook bearish divergence, and it was the clearest advance warning the chart offered. Since then the RSI regime has flipped: where it once oscillated in a bullish 40–90 band, through 2026 it has rejected from an ever-lower ceiling and been capped near 40.
The one bullish tell: momentum stopped confirming
Now the constructive part. Compare the two 2026 lows:
| Low | Price | Weekly RSI |
|---|---|---|
| Feb 2026 | $67.50 | 26.8 |
| Jun 2026 | $60.13 | 27.8 |
Price made a materially lower low; RSI made a higher one. It is mild, and it holds whether you measure the intraweek lows or the weekly closes — so it is a real divergence, not an artifact of where you place the pivots. It is the same positive momentum split that formed at the December-2022 cycle bottom. It is unconfirmed — but it is the first thing on this chart in six months that points up.
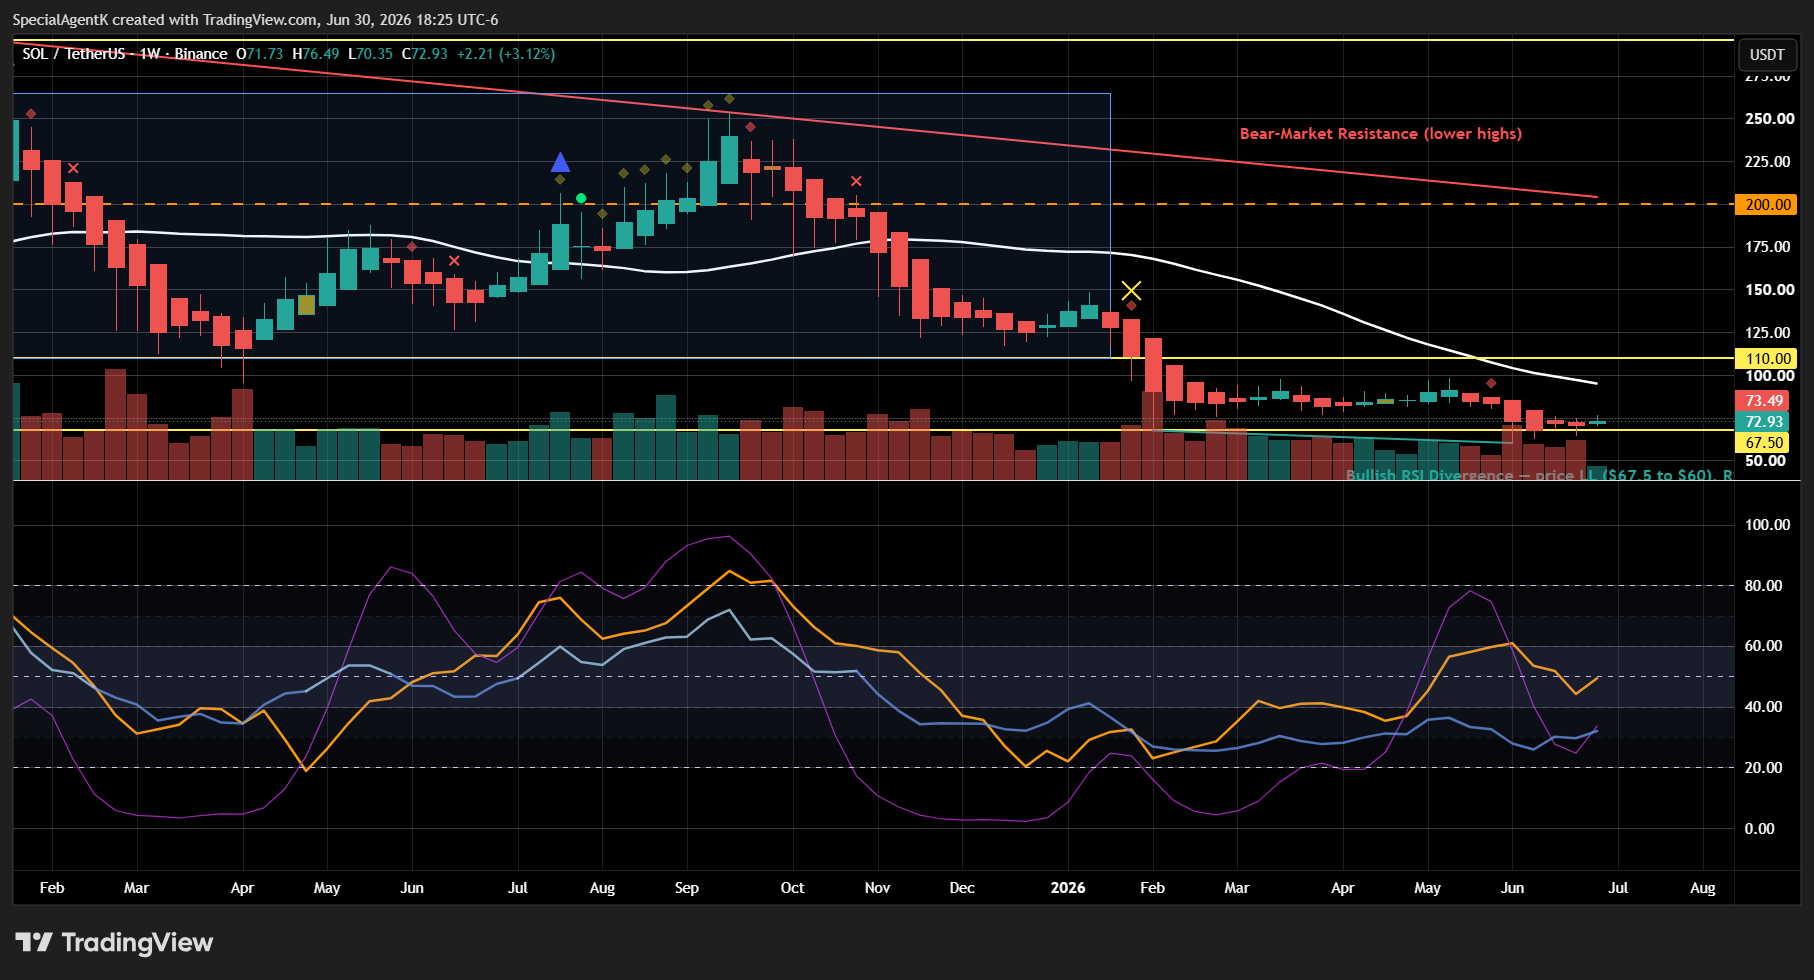
Supporting momentum reads agree the downside is stretched: MarketCipher-B's blue wave sits around −56 near its oversold extreme, money flow is negative, and its Sto-RSI is pinned near single digits — deeply oversold, but not yet turning up.
Levels that matter
| Level | Price | Role |
|---|---|---|
| All-time high | $295.83 | Resistance · Jan-2025 ceiling |
| Distribution top | ~$265 | Resistance · range high |
| Prior-cycle high | ~$200 | Resistance · where the bear line sits |
| Jan-2026 lower high | ~$148 | Resistance |
| Broken range floor | $110 | Resistance · reclaim = range re-entry |
| 30-week SMA | $94.93 | Resistance · first real hurdle, sloping down |
| Pivot / Feb low | $67.50 | Support · nearest shelf |
| Cycle low | $60.13 | Support · line in the sand |
| Deep support | $38.88 | Support · next level if $60 breaks |
Scenarios
- Bullish repair (needs proof, in order). A weekly RSI close back above ~40 breaks the 2026 momentum downtrend and confirms the divergence — typically alongside price reclaiming the $95 30-week average. Only a close back above $110 neutralizes the range breakdown; targets then step to $148 and the ~$200 bear line.
- Base-building / chop (base case). Price holds the $60–$67.50 shelf and oscillates up to the falling 30-week SMA near $95. No trend change — momentum resets while the market waits for a catalyst.
- Bearish continuation. A decisive weekly close below $60, or a fresh RSI low under ~25, negates the divergence and opens a thin pocket toward $38.88. This remains the dominant-trend path until proven otherwise.
Bottom line
The weekly SOL chart is a bear trend that has done real damage: a two-year top broken, a 75% drawdown, price below a falling mean, and a bear-market resistance line sitting $130 overhead. Nothing here says "buy the trend." But momentum has quietly stopped confirming the price lows, and every read of the oscillators says the downside is stretched, not accelerating. That is how bottoms begin — not with a reversal, but with a divergence that no one trusts yet. The structure stays bearish until SOL closes back above $95 and then $110; the whole constructive case dies on a weekly close below $60. Watch the RSI, not the headline.
Method & sources: Derived from the live BINANCE:SOLUSDT weekly (Heikin Ashi) chart. RSI is Wilder's 14-period computed on weekly closes (current 32.0, matching the on-chart Prophesier read of 31.99); levels, patterns, and divergences read directly from price structure and the visible study stack (30-week SMA, MarketCipher-B, Prophesier v5.20 / v6.10). Companion reads: the Solana value/price divergence fundamentals note and the Solana architecture & history primer.
Not financial advice. Automated technical analysis of public price data as of 30 June 2026. SOL is a volatile, high-beta asset; verify levels on your own chart before acting.